top of page
Customer retention and churn reduction strategy
This project identifies churn drivers through segmentation and trend analysis, highlighting key risk factors and high-value customer segments. It translates insights into prioritised retention strategies and estimated financial impact.
1. BUSINESS OVERVIEW
Customer churn has increased significantly throughout 2024, surpassing new customer acquisition and resulting in negative net growth from mid-2024. Churn is accelerating at a faster rate than customer growth, indicating a shift from expansion to contraction and making retention a critical business priority.
2. KEY PERFORMANCE INSIGHTS
Overall churn rate: 22%
Net customer growth turned negative in mid-2024
Churn is accelerating over time, outpacing acquisition
Annual revenue at risk from churn: £14.15M
3. DRIVERS OF CHURN
3.1 Customer experience and pricing
The most cited churn reasons were:
Support: 26%
Budget constraints: 26%
Price: 25%
3.2 Behavioural signals
No single metric strongly predicts churn, but key risk signals include:
Plan downgrades (30% churn rate): early warning indicator of dissatisfaction or cost issues
High support usage (31% churn rate): likely reflects product friction or unresolved issues
Long-term customers (27% churn rate): indicates that churn risk is increases over time
Plan upgrades do not significantly impact risk of churn.
Usage levels alone are not reliable predictors of churn.
3.3 Segment-level insights
Geography:
Highest churn rates: Germany (32%), US (23%, largest absolute churn numbers), France (23%)
Highest revenue loss: US (£7.75M), UK (£2.10M)
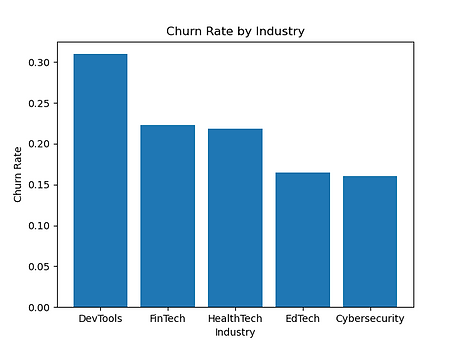
Industry:
Highest churn rates: DevTools (31%), FinTech (22%), HealthTech (22%)
Highest revenue loss: CyberSecurity (£3.35M), FinTech (£3.04M), DevTools (£2.86M)
Customer type:
High-value customers account for the largest proportion of annual revenue loss (£11.4M), particularly high-value customers who joined within the past months, who make up more than half of this revenue loss (£7.7M). This highlights early stage-retention as a high priority.
4. BUSINESS RECOMMENDATIONS
To address churn effectively, the business should prioritise the following actions.
4.1 Protect high-value customers
Focus: US, UK, CyberSecurity, FinTech, DevTools
Prioritise retention efforts for high-revenue segments, particularly newer customers, through proactive engagement and tailored support. Consider a dedicated high-value customer retention team.
4.2 Improve support experience
Reduce response times, resolve recurring issues, and proactively assist high-support users to address one of the most significant churn drivers. Improve onboarding and product guidance to reduce friction. Consider fast tracking support for high-value customers.
4.3 Refine pricing strategy
Reassess pricing vs perceived value. Offer retention-based incentives for at customers at risk of churn.
4.4 Monitor for high-risk behavioural signals
A proactive, trigger-based retention strategy should be implemented, using behavioural signals (e.g. downgrades, high support usage, long tenure) to identify customers at risk of churn and enable timely intervention.
5. FINANCIAL IMPACT
Improving retention could deliver a significant financial impact.
2% churn reduction: £563K annual recovered revenue
5% churn reduction: £1.41M annual recovered revenue
10% churn reduction: £2.82M annual recovered revenue
15% churn reduction: £4.23M annual recovered revenue
TOOLS & SKILLS:
- SQL, Python
- Churn rate analysis
- Customer segmentation
- Behavioural analysis
- Trend analysis
- Revenue impact analysis
CODE:
View full code: https://github.com/jknight-12/churn-project/blob/main/customer-churn-project.ipynb


.png)
bottom of page